How to Track Student Progress Using a Learning Management System (LMS)
By the time second-term results reach parents, it is usually too late to ask what went wrong. A Grade 7 student who scores 48% in a mathematics exam rarely gets there in one day. Weeks earlier there were warning signs: two missed homework submissions on fractions, a quiz score that slipped from 80% to 55%, a short answer marked "see me." Each signal sat in a different place, and nobody saw them together.
Knowing how to track student progress using a learning management system solves that problem. An LMS records assignments, assessment results and learning activity as they happen, so teachers can see who is falling behind on which topic, coordinators can spot patterns across sections, and parents can hear about a difficulty while there is still time to help.
This guide is for principals, academic coordinators and teachers who want a working process rather than another feature list.
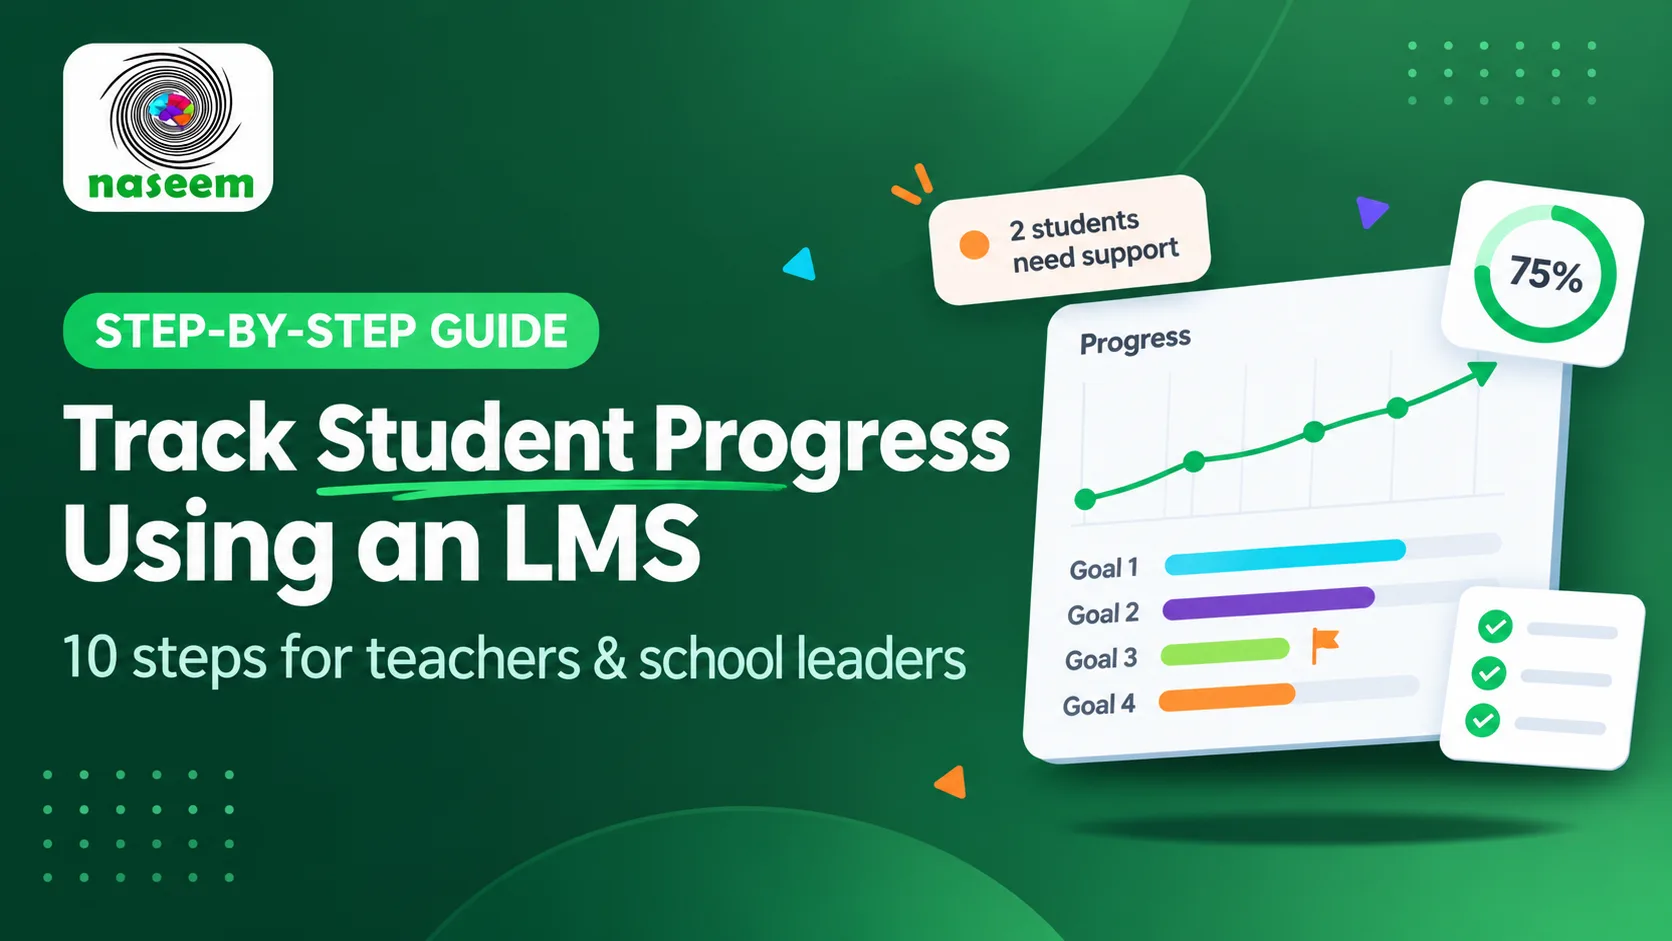
The short answer: Set measurable learning goals for each unit, link assignments and assessments to those goals, and review submissions, scores and topic-level results every week. Compare each student with their own earlier work and with the goal, not only with classmates. Then act on what you find: give targeted feedback, reteach, reassess, and send parents a short, specific update.
What Is Student Progress Tracking?
Student progress tracking is the ongoing process of collecting evidence of what a student has learned, comparing it with the intended learning goals, and using that comparison to decide what support comes next. A report card records results. Progress tracking is what a school does between report cards.
Academic performance and learning progress are related but different. Performance is a snapshot: the score on this test. Progress is movement: whether a student understands more now than a month ago. Consider two students who both score 70% in the October monthly test. Ahmed scored 45% in September; Hira scored 90%. On a grade sheet they look identical, yet Ahmed is catching up and Hira is slipping. A single score cannot show that difference.
Tracking also works on two timescales. Short-term checks, such as weekly submissions and quizzes, catch problems while a topic is still being taught. Long-term reviews across units and terms show whether support worked. Schools track progress at three levels:
| Level | Who reviews it | Suggested rhythm |
|---|---|---|
| Individual student | Subject teacher | Weekly |
| Class or section | Teacher and academic coordinator | Every 2 to 4 weeks |
| Whole school | Principal and academic leadership | Each term |
Why Is Tracking Student Progress Important for Schools?
Feedback is one of the most reliable ways to improve learning, and it depends on knowing where each student stands. The Education Endowment Foundation's Teaching and Learning Toolkit rates feedback as high impact for very low cost, adding an average of six months' progress, based on extensive evidence.
Identifying Students Who Need Additional Support
A student who stops submitting homework in week three is far easier to help than one who fails the term exam in week twelve. Regular tracking turns early signals into a short list of students who need a check-in now.
Understanding Academic Performance
One low score can be a bad day. Three low scores on the same topic are a pattern. Looking at quizzes, assignments and tests together shows the difference.
Improving Teaching Strategies
When most of a section misses the same question, the issue usually lies in how the topic was taught, not with thirty separate students. Class-level results show which explanations landed.
Supporting Personalized Learning
Progress records show who is ready for extension work, who needs more practice and who needs a concept explained differently, so support matches need.
Keeping Parents Informed
Parents often first hear about a problem at a parent-teacher meeting. Regular progress information allows smaller, earlier updates that parents can act on at home.
Making Better Academic Decisions
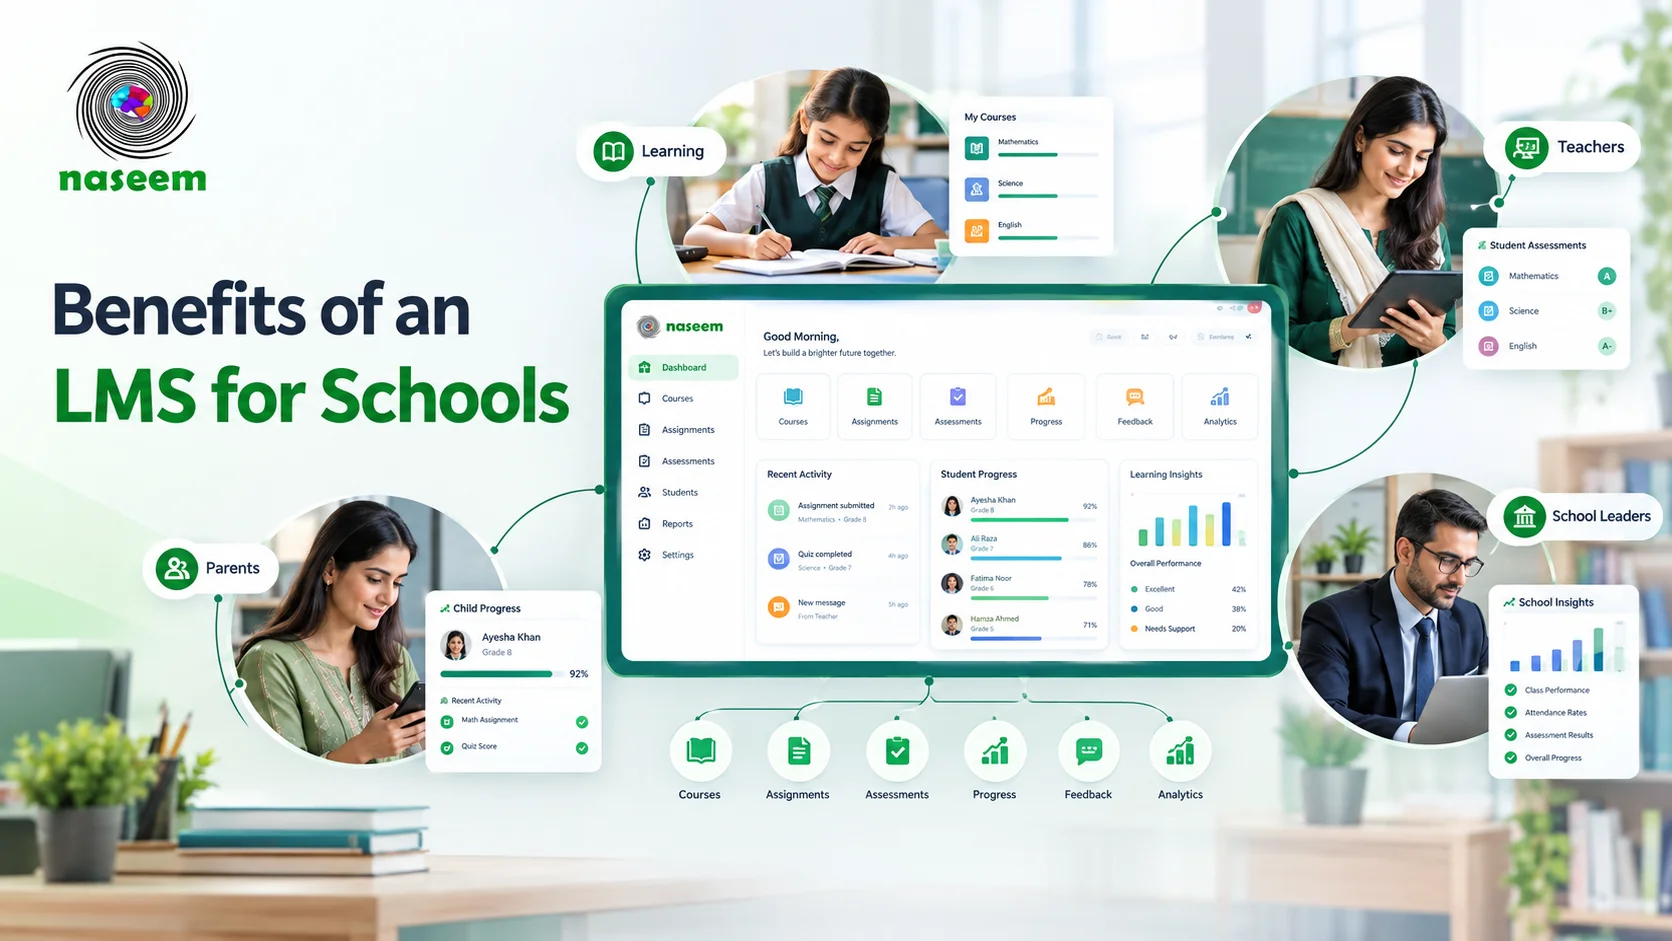
Aggregated results show leaders where to add revision periods, adjust pacing or train teachers. Student progress monitoring is one part of the broader benefits of an LMS for schools, particularly when learning activities, assessments and feedback are managed in one environment.
What Should Schools Monitor When Tracking Student Progress?
No single number tells the whole story. Useful tracking combines several kinds of evidence, and what an LMS records depends on the platform and its configuration. If you are still comparing platforms, our guide to LMS features that support progress tracking explains the tools; this section explains how to read the evidence.
Assessment Results and Grades
Test, quiz and exam scores are the core evidence, but totals hide detail. A 65% unit test might mean 90% on algebraic expressions and 30% on linear equations. Review results by topic, by subject and over time.
Assignment Completion and Submission
Missing work and repeated late submissions are often the earliest warning signs. Completion is not understanding, though: a worksheet may be copied or rushed. Check quality as well as submission.
Course and Lesson Completion
Where supported, lesson completion shows whether students reached the material. It matters most in self-paced or blended units.
Learning Activity and Participation
Logins, resources opened and time on the platform show engagement with the LMS, not learning. A student with few logins may share one phone with siblings. Use activity data to ask questions, never to grade.
Learning Difficulties and Areas Requiring Improvement
Question-level results and recurring errors reveal specific misconceptions. A student who confuses mass and weight across two units needs targeted reteaching, not a general "work harder."
Progress Toward Learning Goals
The most meaningful measure is how many unit goals a student has met. That requires assessments linked to goals, so progress reads "met four of six goals" rather than "averaging 71%."
| Evidence | What it can tell you | What it cannot tell you alone |
|---|---|---|
| Topic-level scores | Which goals are not yet mastered | Why the student struggled |
| Overall grades | Standing at one point in time | Whether the student is improving |
| Missing or late work | Early disengagement | Whether submitted work was understood |
| Logins and time online | Whether the student accesses the LMS | Effort or understanding |
How to Track Student Progress Using an LMS: Step-by-Step Process
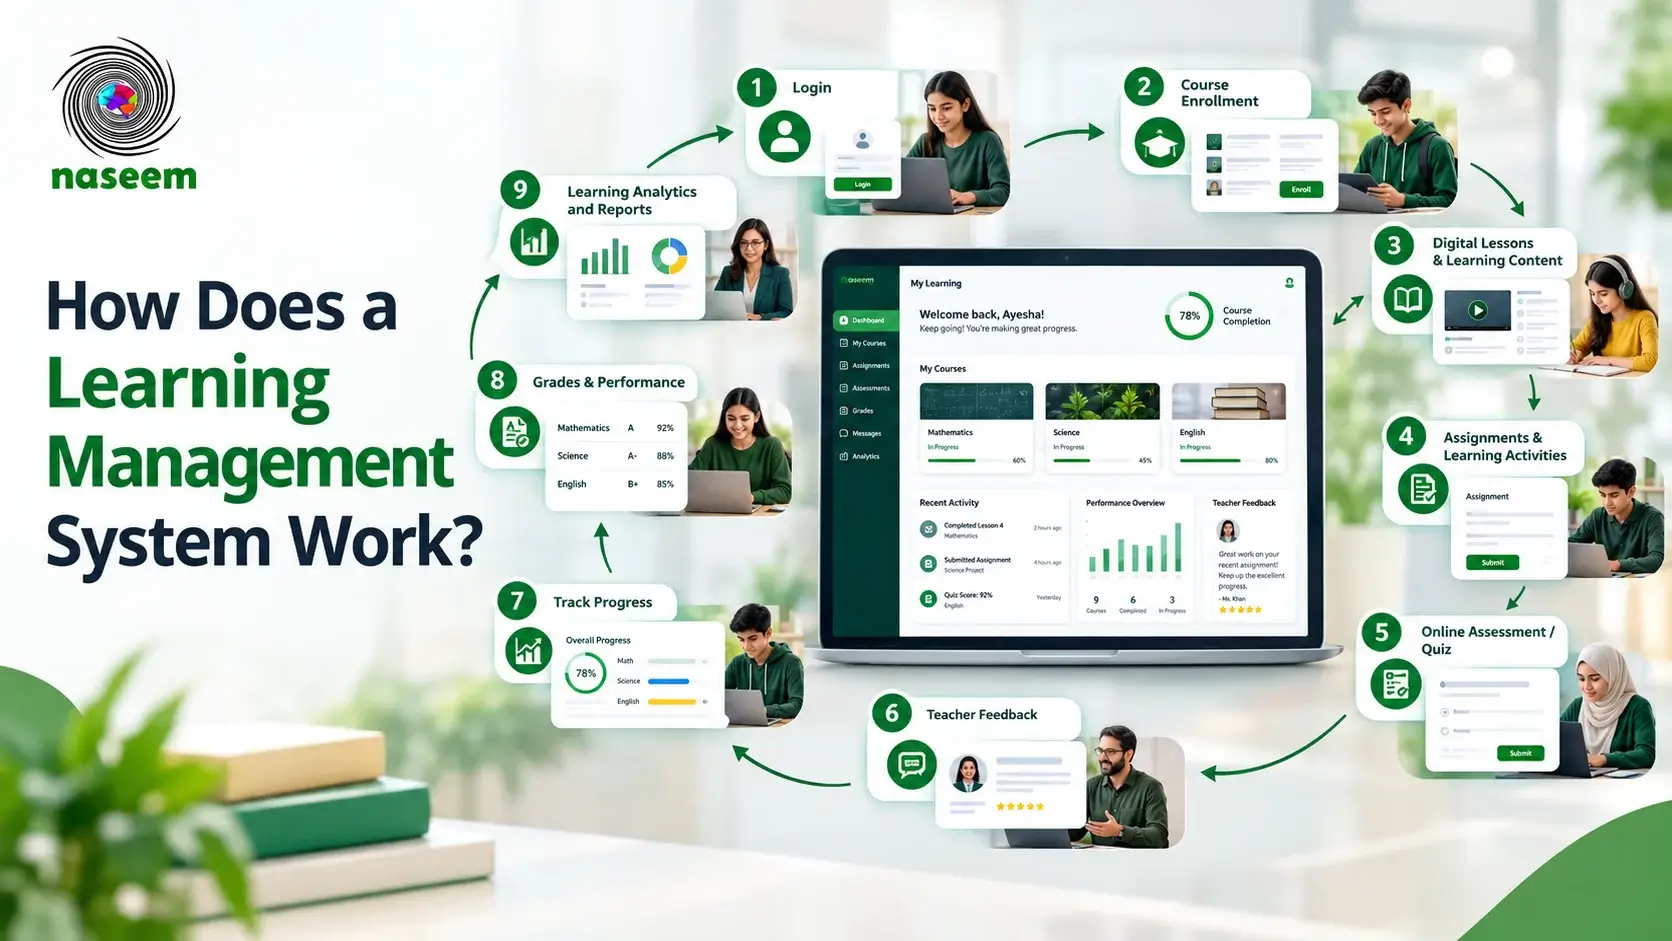
The steps below form a cycle. They follow the data-use cycle in the Institute of Education Sciences practice guide Using Student Achievement Data to Support Instructional Decision Making: collect data, interpret it, adjust teaching, then check the result. The guide's panel rated its supporting evidence as minimal, so treat it as structured expert advice. To understand how these activities connect, it helps to know how a learning management system works with users, courses, assessments and reporting.
Our illustrative example is Ms. Ayesha, a composite Grade 6 science teacher teaching a unit on matter to two sections.
Step 1: Establish Student Learning Goals
Write three to six measurable goals per unit. Ms. Ayesha's include "explain melting using the particle model" and "read a heating curve and identify the melting point." A goal such as "understand matter" cannot be tracked.
Step 2: Organize Courses and Learning Activities
Arrange each unit into lessons, resources, practice tasks and assessments. Where possible, label each assessment or question with its goal, such as "G3: heating curves," using names the whole department shares.
Step 3: Monitor Assignment Completion
Each week, check who has not submitted, who submits late repeatedly and whose work quality has dropped. A simple rule helps: two missed submissions in a unit trigger a teacher message.
Step 4: Evaluate Assessment Results
Short, frequent checks reveal more than one final test. Auto-graded questions give fast results; teacher-marked answers show how students think. Ms. Ayesha's quiz averages 75% in both sections, yet only 4 of 32 students in Section B answer the heating-curve questions correctly.
Step 5: Review Student Learning Activity
A student who scored low and never opened the revision video needs a different response from one who watched it three times. Activity tells you where to look, not what a student understands.
Step 6: Analyze Student Progress Reports
Every two to four weeks, compare:
- Current performance against previous performance
- Individual performance against learning goals
- Assignment completion across a defined period
- Topic-level and subject-level trends across the class
Then write a working explanation. Ms. Ayesha suspects Section B struggles with reading graphs, not the science itself.
Step 7: Identify Students Who Need Additional Support
Flag students when two indicators agree, such as falling scores and missing homework, rather than after one low mark. Then sort them by need: reteaching, organizational help or a conversation about circumstances outside class.
Step 8: Provide Feedback and Learning Support
The EEF guidance report Teacher Feedback to Improve Pupil Learning advises setting clear learning intentions first, then giving well-timed feedback that moves learning forward. Ms. Ayesha reteaches graph reading in a 15-minute starter and assigns a five-question practice set.
Step 9: Communicate Progress With Parents
Send short, specific updates: one strength, one area to improve and one way to help. For example: "Bilal explains melting well but finds heating-curve graphs difficult. Thursday's practice set will help."
Step 10: Review Progress and Adjust Learning Strategies
Reassess the goal and compare results. After the reteach, 24 of 32 Section B students answer correctly. Ms. Ayesha moves on and gives the remaining eight one more small-group session.
- Set goalsStep 1
- TeachStep 2
- MonitorStep 3
- AssessSteps 4 and 5
- ReviewStep 6
- SupportSteps 7 to 9
- ReassessStep 10
- ↺ goal met: next unit → back to Set goals↺ not yet met: reteach → back to Support
How Teachers Can Use LMS Data to Improve Student Performance
The examples below are illustrative, but each reflects a decision teachers make every week.
Recognizing Repeated Learning Difficulties
If students confuse area and perimeter in a quiz, homework and unit test, the misconception has survived three rounds of teaching. It needs a new explanation, not more of the same practice.
Adjusting Lesson Plans
When most of a class misses one idea, change the next lesson. A teacher who sees widespread errors with negative numbers might open with a five-minute number-line activity.
Providing Targeted Learning Resources
Group students by the goal they have not met, not by overall grade, and assign each group a matching resource through the same course page.
Offering Individualized Feedback
"Your last two lab reports had strong methods but no conclusion linked to the data" helps more than "good effort." Easy access to earlier work makes that specificity possible.
Monitoring Improvement Over Time
Recheck the same goal within two weeks of any intervention. If students have not improved, change the approach rather than repeating it.
How School Administrators Can Monitor Student Progress Across the School
Teachers ask which students need help. Leaders ask which classes, subjects and grades need help, and why. Useful school-level views include class performance on common assessments, subject trends, grade-level comparisons, topic-level outcomes and completion patterns that may reveal workload clashes.
Comparisons are fair only when sections sit the same assessment with shared marking guidance. Results should open a conversation with teachers, not settle a judgment; a weaker section may reflect absence or a mid-term teacher change.
A monthly coordinator meeting works well: review completion rates, topic results and flagged students, and end each item with a decision and an owner. An LMS with a principal dashboard can speed this up, although institutional reporting varies widely between platforms.
How Parents Can Stay Informed About Student Progress Through an LMS
Depending on the platform and school policy, a parent portal can show assessment results, assignments due or missing, achievements and areas needing attention.
More information is not always better. A parent who sees every quiz score instantly may react to one bad day, so many schools release results after teacher review with a short explanatory comment.
Each parent account should show only that parent's child. UNESCO's guidance on personal data and privacy protection in online learning is a useful starting point. For families with limited connectivity, a printed summary or phone call still counts.
How Learning Analytics Support Student Progress Tracking
The Society for Learning Analytics Research updated its definition in 2025: learning analytics covers collecting, analyzing, interpreting and communicating data about learners to produce actionable insights. Progress tracking follows individuals against goals; analytics finds patterns across students, assessments and time, such as performance trends, the hardest questions and early signs of difficulty.
Automated "at risk" flags deserve caution. A chapter in the OECD's Digital Education Outlook 2021 compared 110 dropout predictors and found most performed no better than chance. Treat any flag as a prompt for a teacher to look closer. Analytics support educational judgment; they do not replace teachers.
Common Challenges Schools Face When Tracking Student Progress
| Challenge | What helps |
|---|---|
| Fragmented records and manual reporting | One agreed place for marks and submissions |
| Inconsistent assessment records | Shared naming, goal labels and weighting |
| Limited visibility into individual progress | Topic-level results reviewed weekly |
| Delayed feedback | Short auto-graded checks plus targeted comments |
| Recurring difficulties go unnoticed | Question-level analysis across sections |
| Disconnected parent communication | A defined parent view and scheduled updates |
| Poor interpretation of data | Staff training on what each indicator shows |
| Student privacy concerns | Role-based permissions and a clear data policy |
Connectivity also varies widely in Pakistan, so low activity can reflect device access rather than effort. Our guide to LMS adoption in Pakistani schools covers infrastructure planning.
What to Look for in an LMS for Student Progress Tracking
Whether a vendor calls its product an LMS, a student progress tracking system or student performance monitoring software, ask it to demonstrate these capabilities with realistic data:
- Student performance dashboards and progress reports
- Assessment and grade management, including auto-grading
- Assignment tracking with missing and late work
- Learning analytics by topic or question
- Teacher access limited to their own classes
- Parent visibility and school-level reporting
- Data privacy settings and role-based permissions
- Ease of use and access on student smartphones
Evaluate actual product capabilities rather than marketing descriptions. Schools comparing platforms should also consider their wider requirements, covered in our guide to choosing an LMS for your school.
How Naseem Education Supports Student Progress Tracking
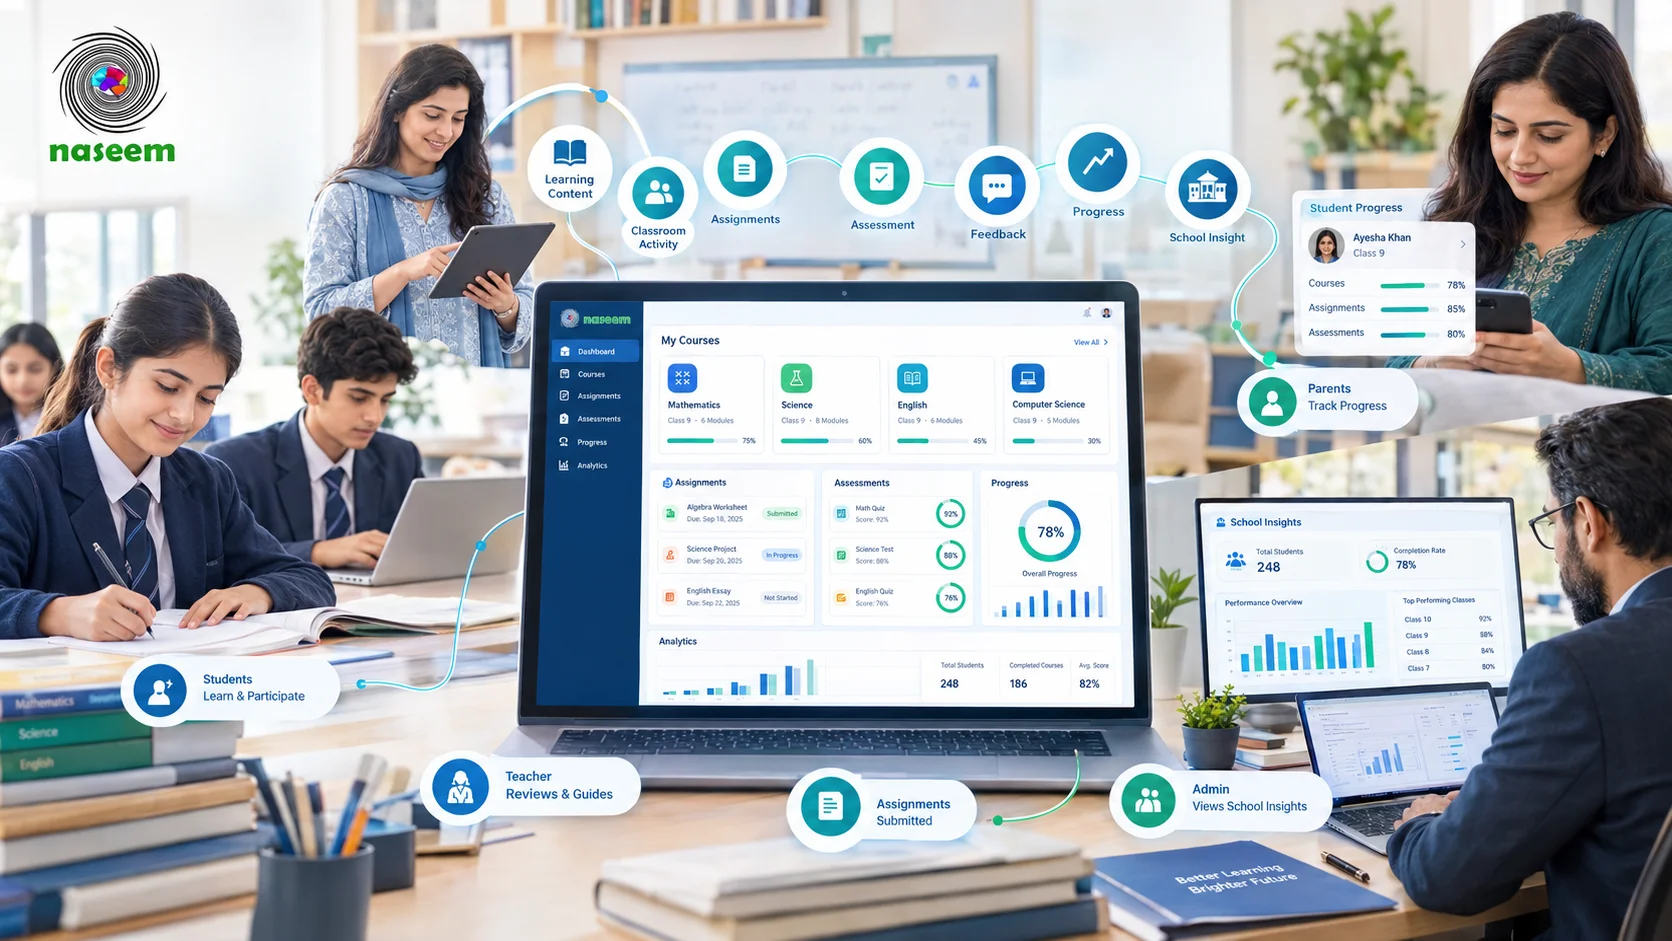
Naseem Education is a school-focused LMS that connects students, teachers, parents and school leaders in one learning environment. Its capabilities align with the process above:
- Steps 1 to 3: teachers organize course materials, assignments and learning activities for each class.
- Steps 4 and 8: assessment tools support auto-grading where suitable, teacher review and feedback.
- Steps 5 to 7: student progress tracking and learning analytics bring activity and assessment information together for teachers and school leaders.
- Step 9: parents view the information the school makes available through authorized accounts.
Available reports depend on each school's configuration, so judge fit by watching your own workflow on the platform. Explore the Naseem Education LMS or request a demo and ask the team to walk through one of your units.
Final Thoughts
A grade shows where a student landed. Progress tracking shows which direction they are moving and what to do while the topic is still being taught. An LMS keeps assignments, results, feedback and activity together so patterns appear early, but teachers still interpret them. Set clear goals, review a small set of indicators weekly, act, and check whether the action worked.
Frequently Asked Questions
How does an LMS track student progress?
What data does an LMS use to monitor student performance?
Can teachers track individual student progress using an LMS?
How can schools identify students who are falling behind?
Can an LMS track assignment completion and assessment results?
How do learning analytics help teachers monitor students?
How can parents monitor student progress through an LMS?
What features should an LMS have for student progress tracking?
Ready to Bring Your School’s Learning Together?
Give your school a connected learning management system designed to support students, teachers, parents, and school leaders.